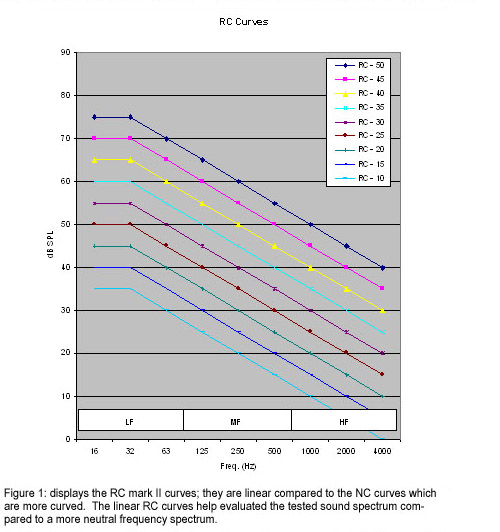
This method is in many ways alike to NC, a series of curves are applied to the tested noise spectrum. It is another way to rate the scope and character of problematic background noise based on the frequencies used for speech.
The shape of the curves differ from NC curves, and there are 2 extra frequency bands, 16 and 31.5Hz. The different shape of the curves are designed to gauge a neutral sounding frequency spectrum more accurately then the NC curves.
RC was established in 1981, ASHRAE (the American Society of Heating, Refrigeration and Air-Conditioning Engineers) sponsored a series of experiments and established RC mark II in 1997. RC mark I was designed purely to test background noise generated by HVAC (heating, ventilation, and air conditioning) systems. RC mark II was designed for testing HVAC as well as other applications in the field. RC mark II is a revised version of RC mark I, ASHRAE added a “Procedure for estimating occupant satisfaction when the spectrum does not have the shape of an RC curve.” – ASHRAE Fundamentals Handbook 2001 F.7.13
 Testing NC values results in a single number value, for example
NC 40 means that the highest NC curve to match the tested sound level data was NC – 40. An example of a RC test result would look like this: RC 35 (HF). When testing RC mark II, there are three different aspects. The first is the number value, which is arrived at differently than NC. Instead of plotting the tested frequency spectrum against the RC curves, tested SPL levels in the 500, 1000, and 2000 Hz octave bands are averaged together. Than the curve with the closest to the averaged value at 1000 Hz (rounded to the closest integer) is chosen and that represents the numerical value.
The second aspect of RC mark II is quality aspect. RC mark II includes a method to quantify the sound quality in the tested space. The quality options are as follows: N for neutral, LF for a rumble in the low frequencies, MF describes a roar in the mid frequencies, HF describes a high frequency hiss. The last two options describe acoustically induced vibration, LFb is a moderate but noticeable amount of vibration, and LFa is a very noticeable amount of vibration.
The third aspect of RC mark II is the occupant satisfaction procedure when the tested sound spectrum does not have the shape of an RC curve. This procedure could be used when a space has a very audible tonal characteristic but in each other frequency band is within the recommended levels.
Example: RC 35 (HF)
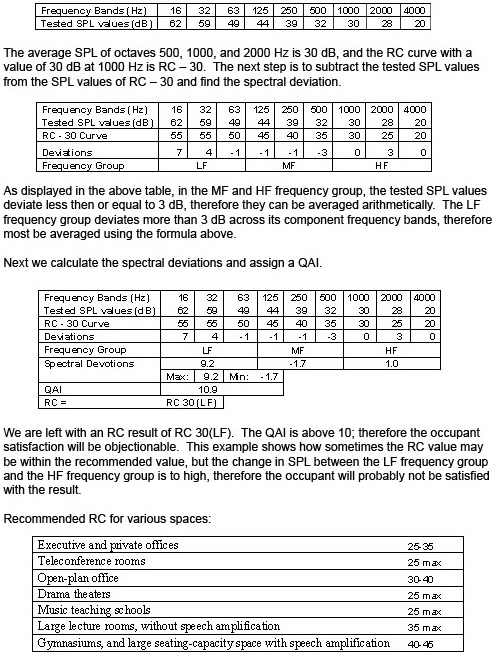
The number following RC is the average sound pressure level tested in the 500, 1000, and 2000 Hz octave bands. These frequency bands are the primary frequency bands of speech. For example if the tested SPL’s were as follows:
 The average in dB of the tested values in the 500, 1000, and 2000 octave bands would results in 35, The RC curve with a value of 35 dB at 1000 Hz is RC – 35 therefore we have the above RC numerical value. Following the number is the (HF), which is a ‘qualitative descriptor’ or QAI of the perceived sound.
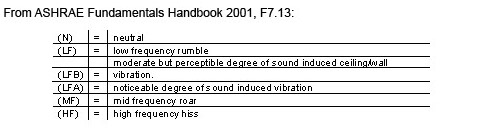 To determine the QAI, one must calculate where the tested frequency spectrum differs from the RC curve. The spectrum is split up into three groups, low frequencies consist of 16 - 63Hz; mid frequencies consist of 125 - 500Hz; and high frequencies consist of 1 k - 4 kHz.
The first step is to subtract the tested SPL levels from the chosen RC contour values:
To determine the QAI, one must calculate where the tested frequency spectrum differs from the RC curve. The spectrum is split up into three groups, low frequencies consist of 16 - 63Hz; mid frequencies consist of 125 - 500Hz; and high frequencies consist of 1 k - 4 kHz.
The first step is to subtract the tested SPL levels from the chosen RC contour values:
 If the amount of deviation between each octave band in each separate frequency group differs less then 3 dB, then the typical arithmetic average of each frequency group can be calculated. If the SPL level between octave bands in each frequency group differs more than 3 dB, a more complicated method of averaging the SPL’s must be used.
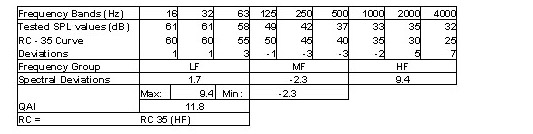
In the above chart we see that in the LF frequency group, the deviations are less than 3 dB, therefore an arithmetic average can be calculated, and this is true for the MF frequency group as well. In the HF frequency group the deviations exceed 3 dB there for we must use the following formula to average the values:
If the amount of deviation between each octave band in each separate frequency group differs less then 3 dB, then the typical arithmetic average of each frequency group can be calculated. If the SPL level between octave bands in each frequency group differs more than 3 dB, a more complicated method of averaging the SPL’s must be used.
In the above chart we see that in the LF frequency group, the deviations are less than 3 dB, therefore an arithmetic average can be calculated, and this is true for the MF frequency group as well. In the HF frequency group the deviations exceed 3 dB there for we must use the following formula to average the values:
This way we end up with 3 values expressed in dB, the LF value, MF value, and HF value. The QAI is the range between the lowest value, and the highest. If the range is less than, or equal too 5dB, the QAI assigned is (N), or neutral. If the range is higher than 5dB, the descriptor is assigned according to which frequency group is highest.
For example, if we calculated the spectral deviations in the LF group to be 1 dB, in the MF to be 4 dB, and in the HF to be 3 dB.
The range between the lowest value and the highest value would be 4 dB, which would be lower than 5dB. Therefore the QAI assigned would be (N). RC mark II also involves estimating the occupant satisfaction; we do this using the QAI. There are three categories of occupant satisfaction, acceptable, marginal, and objectionable. To classify RC test data into one of the categories, the range of the three frequency groups, the QAI, and the RC contour are considered.
An RC qualifier of (N) means there are no frequency group dominant over another, and the range between the LF group and the HF group is less than 5dB. A QAI of less than 5dB would rate occupant satisfaction as acceptable. A QAI that is larger than 5dB but less than 10 dB would rate occupant satisfaction as questionable. Any QAI that is larger than 10dB would rate an occupant satisfaction of objectionable.
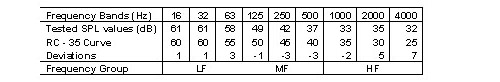
Another example: A series of spectrum analysis tests are preformed in an executive office. The recommended RC contour for such a space is RC 25-35, the recommended RC value for an executive office is between 25 - 35. The tested frequencies are as follows: